
On-Chain Data School (Part Four): Visualizing BTC UTXO Age Price Distribution Chart


Original Article Title: "On-chain Data Classroom (Part 4): Visualizing the $BTC Chip Price Distribution Chart "
Original Article Author: Mr. Berg, On-chain Data Analyst
This article is the 4th in the On-chain Data Classroom series, which consists of 10 articles in total. Take you step by step to understand on-chain data analysis. Interested readers are welcome to follow this series of articles.
Related Reading: "On-chain Data Classroom (Part 3): Have the Bottom Fishing Whales Taken Profit?"
TLDR
- This article will introduce the on-chain metric URPD
- URPD shows the distribution of $BTC chips at different holding costs
- URPD can be used to observe chip turnover, distribution conditions, and provide guidance on trends
What is URPD?
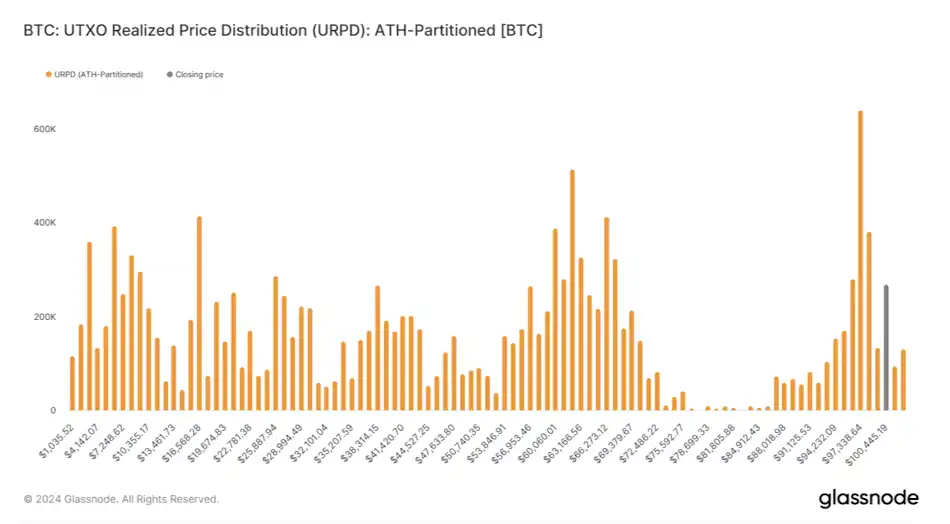
URPD, short for UTXO Realized Price Distribution.
Due to BTC's unique UTXO blockchain structure,
we can track data on-chain that is unavailable in traditional financial markets.
The URPD chart is an indicator derived from this principle,
where we can see the number of chips corresponding to each price level on the chart,
equivalent to showing the "buying cost of each $BTC."
URPD, Chip Turnover, Accumulation, and Distribution
After understanding the concept of URPD,
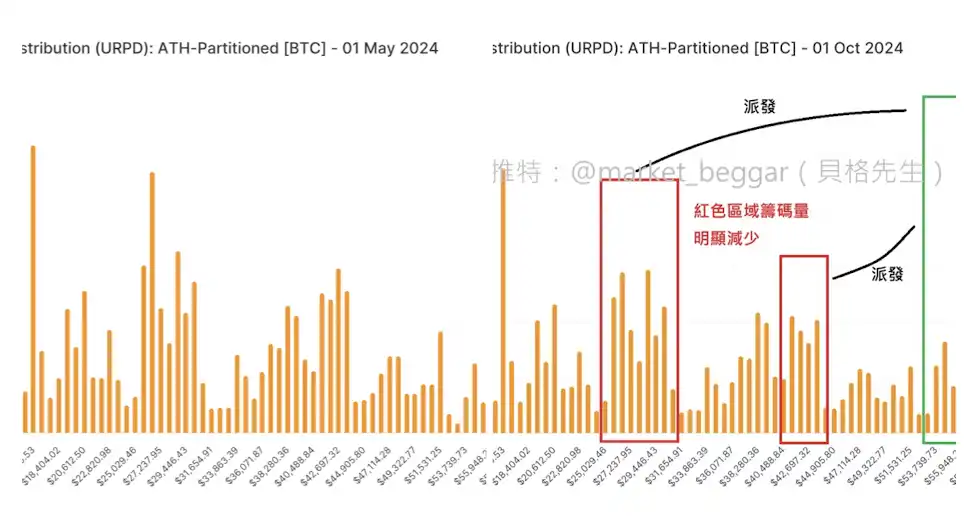
we can then observe the turnover of chips at different price levels based on the daily URPD changes.
For example:
Chart one below is the URPD chart for May 1,
while chart two is the URPD chart for October 1.
After experiencing five months of wide-ranging fluctuations in price,
It is quite obvious to see the phenomenon of low-cost chips being distributed upwards.
URPD, Chip Turnover, Accumulation, and Distribution (2)
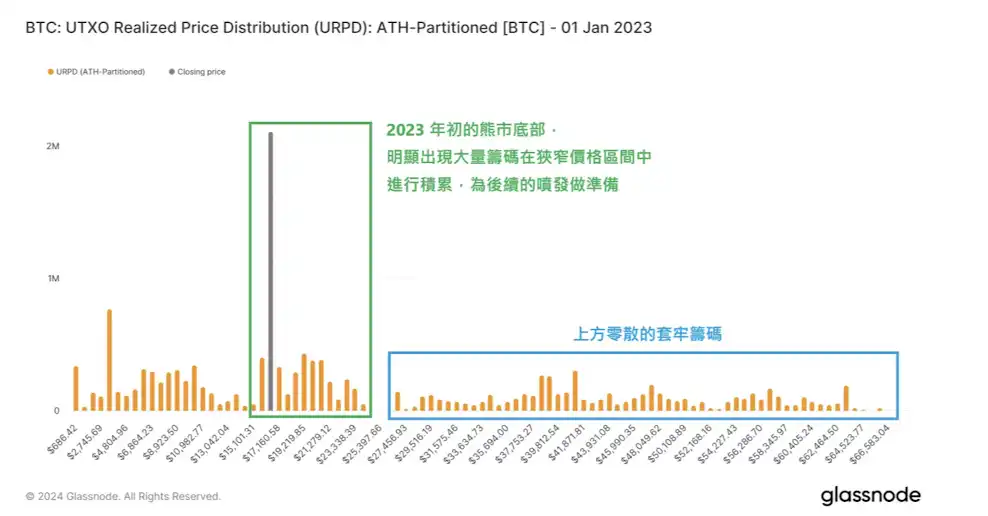
In history, at a market top, it is usually accompanied by the tail end of high-profit low-cost chip distribution;
while at a market bottom, a large amount of chips can be seen accumulating in a relatively narrow range.
Therefore, in analysis,
URPD is often observed together with other data (such as realized profit, MVRV, etc.),
integrating logical thinking to understand the market from a more comprehensive perspective.
Support, Resistance, Consensus
When a significant amount of chips begins to accumulate in a single price range,
it indicates that a supply-demand consensus has gradually formed in that range.
Once the price later rapidly rises out of that range,
due to the high turnover of chips in that range,
it is likely to provide support in the future;
Conversely, if the price falls below that range,
the chips in that range will become trapped chips,
which may act as resistance levels in future price increases.
Conclusion
The above is all the content of On-Chain Data School (Part Four). For readers interested in delving deeper into on-chain data analysis, remember to keep track of this series of articles!
If you want to see more analysis and educational content on on-chain data, feel free to follow my Twitter handle (X)!
Hope this article has been helpful to you. Thank you for reading.
You may also like

Morning Report | Binance launches DYOR research tool; YZi Labs launches recruitment platform YZi Talent; Vitalik states that the Ethereum Foundation will "downsize" and reduce the amount of ETH sold

Morning News | Michael Saylor stated that this week he bought bonds instead of Bitcoin; StablR was attacked and lost about 2.8 million dollars; the U.S. Congress is pushing the Bitcoin Reserve Act again

SuperEx's Mars exploration dream: Digital currency is the key to unlocking economic exchanges in the interstellar era

Key Takeaways: Full Text of Google Chief Scientist Shanahan's Speech

Agentic Design Patterns: A book that made me rethink "What exactly is an Agent?"

The richest chairman of the Federal Reserve in 112 years has arrived: Kevin Warsh is rewriting the rules

Vitalik talks about the future of the Ethereum Foundation: a smaller, more distinctive, yet more enduring ship

New Types of Information Laundering in Prediction Markets: How Secrets Integrate into Investment Signals

Vitalik emphasized in a post that Ethereum must be "amazing," but the foundation is not the center
DeFi has reached its most dangerous moment: the real vulnerabilities are not in the code

WEEX Bitcoin Pizza Day: Zero Fees, BTC Cashback & 150,000 USDT to Honor Crypto History

a16z: 7 Images to Understand How Tokenization Changes the Nature of Assets

The secret to Hyperliquid's success dismantled from the five-layer financial stack
After Futu Securities was banned, will buying stocks on-chain be the new remedy?

Why Crypto Traders Are Watching Gold and Nasdaq Again in 2026
Why have foreign exchange stablecoins never taken off?

AIDC, computing power leasing, and cloud: The "three-part thesis" of AI transformation in cryptocurrency mining farms

Futu has had all its illegal gains confiscated, reminding cryptocurrency exchanges
Morning Report | Binance launches DYOR research tool; YZi Labs launches recruitment platform YZi Talent; Vitalik states that the Ethereum Foundation will "downsize" and reduce the amount of ETH sold
Morning News | Michael Saylor stated that this week he bought bonds instead of Bitcoin; StablR was attacked and lost about 2.8 million dollars; the U.S. Congress is pushing the Bitcoin Reserve Act again
SuperEx's Mars exploration dream: Digital currency is the key to unlocking economic exchanges in the interstellar era
Key Takeaways: Full Text of Google Chief Scientist Shanahan's Speech
Agentic Design Patterns: A book that made me rethink "What exactly is an Agent?"
The richest chairman of the Federal Reserve in 112 years has arrived: Kevin Warsh is rewriting the rules

Contents
Popular coins
Latest Crypto News